
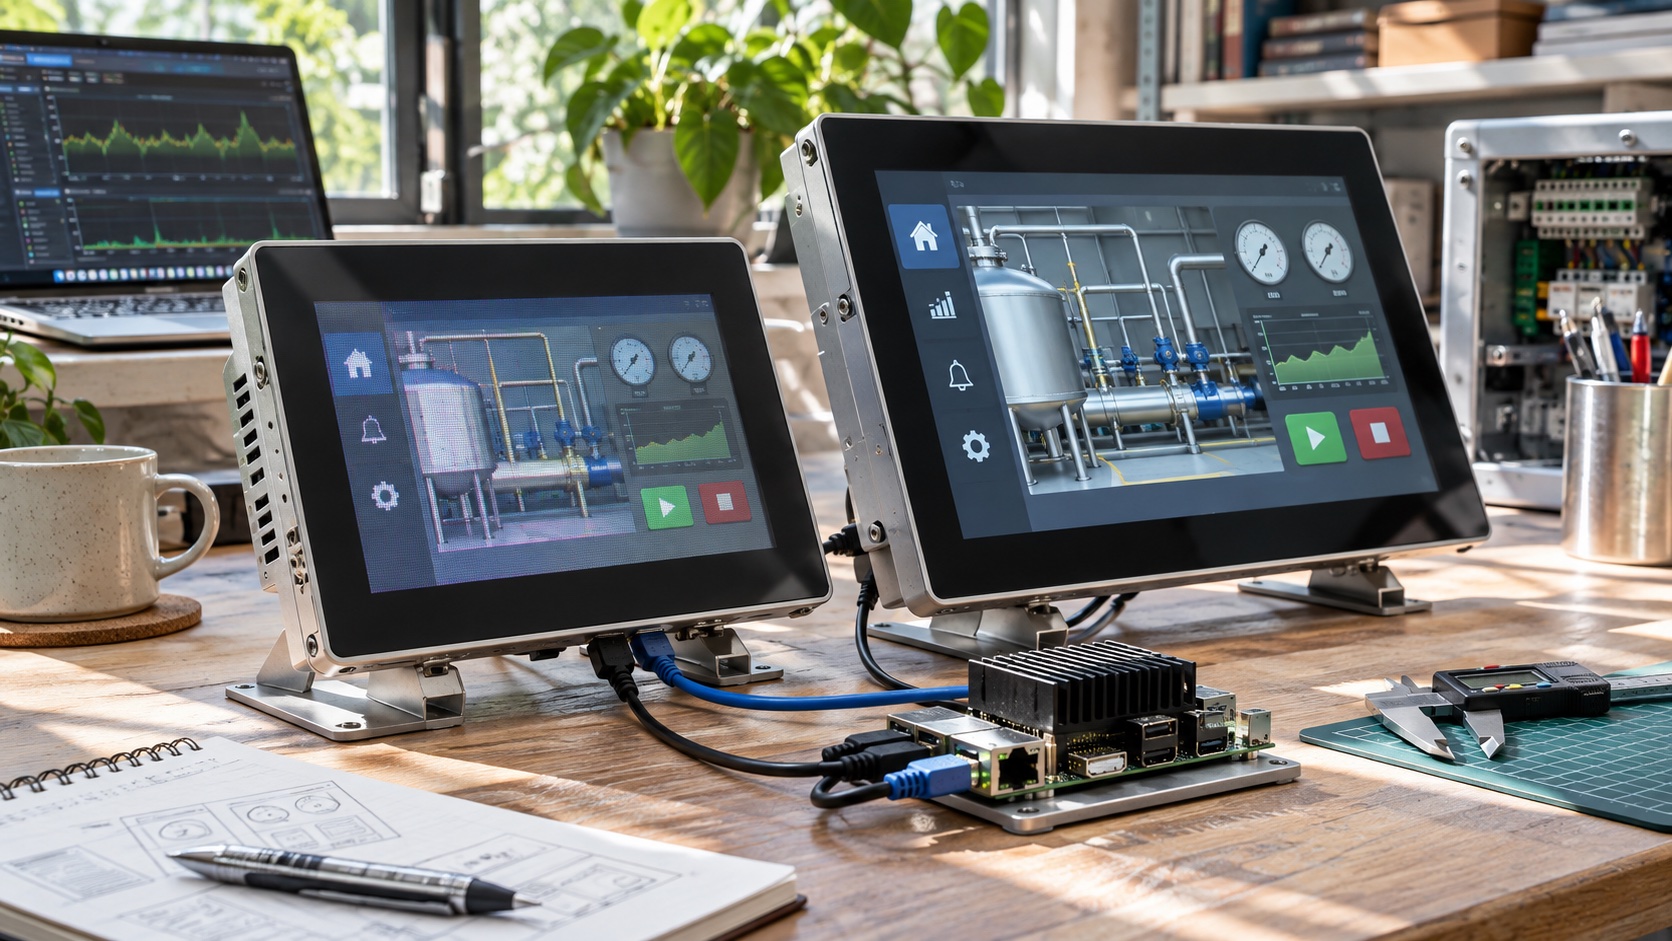
A high-resolution panel can make an Android HMI look excellent in a static screenshot and feel sluggish during scrolling, chart updates, or video overlays. The extra pixels affect more than the display connector. They increase buffer sizes, memory traffic, composition work, and sometimes thermal load.
Choose resolution from viewing distance and task requirements, then validate the complete graphics pipeline with the production UI. GPU headroom is the remaining capacity under the worst required workload after the device reaches thermal steady state.
Start with the work the screen must support
A maintenance panel viewed at arm’s length needs readable labels, reliable touch targets, and clear status changes. It may gain little from a resolution that only makes small text possible. A detailed inspection image or dense engineering chart has a different requirement.
Define physical screen size, viewing distance, orientation, minimum text size, touch target size, ambient light, and required content. Density settings can make the same resolution behave very differently in Android.
Keep resolution and refresh rate separate. A higher refresh rate can improve motion but also raises the frequency at which the system must produce frames. A static control panel may benefit more from stable interaction latency than from a headline refresh specification.
| Choice | Potential benefit | Cost to verify |
|---|---|---|
| Higher pixel count | More detail and workspace | Larger buffers and composition load |
| Higher refresh rate | Smoother motion | Shorter frame budget and more activity |
| Higher color depth | Smoother gradients | Interface and buffer-format support |
| Larger physical screen | Easier viewing | Backlight power and enclosure area |
| Lower logical density | More content visible | Smaller text and touch targets |
Calculate the simple quantities first
A 1920 by 1080 image contains about 2.07 million pixels. A 3840 by 2160 image contains about 8.29 million, four times as many. At four bytes per pixel, one uncompressed buffer is approximately 8.3 MB or 33.2 MB respectively, before alignment and implementation overhead.
Several buffers may exist for each surface, and several surfaces may be composed. Camera previews, video, translucent overlays, and off-screen effects add their own allocations. These calculations are useful for identifying risk, but they are not a prediction of actual bandwidth or GPU utilization.
At 60 Hz, a frame interval is about 16.7 milliseconds. Application work, rendering, composition, synchronization, and presentation must fit the relevant pipeline deadlines. At 30 Hz the interval doubles, but touch response and animation expectations also change.
Use these numbers to construct a workload budget. Do not compare boards only by GPU clock or core count.
Understand which engine is doing the work
An Android display pipeline may use hardware composition planes, GPU composition, video decoding hardware, and display-controller scaling. A simple full-screen video can be cheap while several translucent application layers force expensive composition.
Check the BSP’s actual composition behavior. A processor may advertise multiple display planes while the shipped driver supports only a limited combination of scaling, rotation, color formats, and overlays.
Test the transitions that change composition strategy. Opening a drawer over video, rotating the display, adding a camera preview, or enabling screen capture can alter the path. The worst workload may last only a few seconds, yet still determine whether users experience visible stutter.
The display integration guide helps separate panel and touch issues from rendering problems. A slow response can also originate in touch sampling, input processing, or application logic.
Build a representative workload
Use the real APK and realistic data volume. Populate tables, charts, images, and notifications to expected field levels. Exercise the busiest supported screen rather than a minimal demonstration layout.
Include simultaneous activity: network synchronization, database writes, scanner input, video playback, and background services. The graphics pipeline shares memory and power with the rest of the SoC.
Measure frame timing and input-to-visible-response latency. Average frame rate can hide long pauses. Report slow frames, dropped frames, and the distribution of transaction response times.
| Workload | What it reveals | Useful evidence |
|---|---|---|
| Long list scrolling | Layout and allocation cost | Frame timeline and pause distribution |
| Live chart updates | Repeated drawing and data processing | CPU/GPU timing and memory traffic |
| Video plus overlay | Composition-path changes | Plane use and dropped frames |
| Camera preview | Buffer transfer and format conversion | Latency and sustained frame delivery |
| Large database refresh | Contention outside graphics | UI stalls and storage activity |
| Display rotation | Reallocation and configuration handling | Recovery time and layout correctness |
Measure after thermal stabilization
A short run on an open board can overstate available performance. Test inside the final enclosure with target brightness and ambient conditions. Wait until temperatures and clocks settle.
Record thermal policy, CPU and GPU frequencies, power, frame timing, and user-visible latency together. If frame quality drops after twenty minutes, the application may be exceeding the sustained thermal budget rather than an instantaneous GPU limit.
The fanless thermal guide explains how to validate the assembled heat path. Keep thermal mitigation enabled during performance qualification.
Define headroom through a controlled additional workload or measured margin against deadlines. Avoid claiming a universal safe utilization percentage. Driver counters, workload patterns, and shared resources differ between platforms.
Reduce unnecessary rendering before changing hardware
Remove invisible animations, oversized images, repeated layout passes, and expensive effects that do not improve the operator’s task. Cache stable content appropriately and avoid refreshing the entire screen for a small data change.
Check image dimensions. Decoding a very large source image to display a small thumbnail wastes memory and processing. Review transparency and overlapping layers, especially over video.
Consider rendering selected content at a lower resolution only when it remains readable and the architecture supports it cleanly. Scaling can introduce blur, and text should be assessed at the actual viewing distance.
Do not lower touch target size to make a dense screen fit. A missed or incorrect action costs more than a small reduction in visible data.
Qualify display changes as system changes
Moving from one panel resolution to another can change interface bandwidth, lane count, memory pressure, application layouts, power, and thermal behavior. Update the device configuration and test the whole product.
Keep a record of native resolution, Android logical density, orientation, refresh rate, pixel format, and any scaling. A technician should be able to identify a configuration mismatch without guessing from screen appearance.
If two product variants share an image, test both. A layout that works on the larger display can clip critical controls on the smaller one, even when the application launches successfully.
Frequently asked questions
Is a 4K display always better for an industrial HMI?
No. It is useful when the task requires the additional detail and the product can sustain the graphics and power load. Readability and dependable interaction remain the primary criteria.
Does more RAM fix a slow interface?
It helps only when memory capacity or pressure is the limiting factor. Layout work, composition, storage stalls, thermal throttling, and touch latency need separate diagnosis.
Can benchmarks replace testing the production APK?
They help compare platforms under defined workloads. They do not reproduce your surfaces, data, peripherals, or enclosure, so they cannot establish product acceptance.
What to retain at release
Save the busiest-screen test data, frame traces, thermal conditions, application build, and display configuration. Give future revisions the same pass criteria. The BSP evaluation checklist should include access to the profiling tools needed to maintain this evidence.